CT scanner calibration for MCsquare
Contents
1. Introduction
The patient CT image, generally provided in Hounsfield Units (HU), has to be converted in physical quantities more appropriate for the simulation of particle interactions. Protons undergo two main types of interactions that require the definition of specific material properties:-
Electromagnetic interactions:
The energy loss through electromagnetic interactions is described by stopping powers (SP), which can be computed from the electron density and mean excitation energy (I-value) of the crossed material.
-
Nuclear interactions:
In MCsquare, nuclear interactions are sampled from cross sections tabulated for the main atomic elements that compose human tissues.
2. MCsquare materials database
In order to simulate particle interactions, MCsquare associates each voxel of the CT image to a mass density and one of the material defined in the Materials folder. The Materials/list.dat file, lists all materials available in this database and their associated ID. The first twelve lines specify atomic elements; the remaining ones are for compound materials.The following three files are provided in each material folder:
-
Material_Properties.dat:
This file includes important properties of the material such as mass density, electron density or radiation length. For compound materials, the elemental composition used for the simulation of nuclear interactions is also provided. Only elements for which ICRU nuclear cross-sections are available are considered.
-
G4_Stop_Pow.dat: (used by default)
Mass stopping powers pre-computed with Geant4 for energies between 0 and 400 MeV, by step of 0.5 MeV.
-
PSTAR_Stop_Pow.dat: (optional, not used by default)
Mass stopping powers extracted from PSTAR database for energies between 0 and 400 MeV, by step of 0.5 MeV.
- ICRU_Nuclear_elastic.dat
- ICRU_Nuclear_inelastic.dat
- ICRU_PromptGamma.dat
3. Conversion scheme in MCsquare
In order to associate a HU number to a specific mass density and material, MCsquare requires a CT calibration curve, that should be generated for each CT scanner. Example of CT calibration models for MCsquare are available in the Scanners directory of the git repository. Additional models can be constructed by creating, for each scanner, a subfolder containing the two following text files:-
HU_Density_Conversion.txt:
This file matches HU in the first column to mass densities in the second one (see Figure 1). MCsquare performs a linear interpolation between these points to convert intermediary HU. For the conversion of HU outside the defined range, a linear extrapolation is performed.
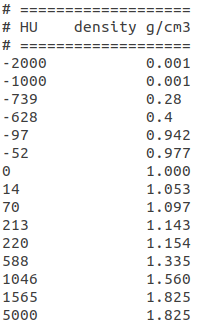
Figure 1: Example of MCsquarre calibration file for the conversion of HU to mass densities
(Scanners/default/HU_Density_Conversion.txt)
-
HU_Material_Conversion.txt:
This file matches HU in the first column to a material ID coming from Materials/list.dat file in the second column (see Figure 2). Each row defines the beginning of a new material. The same material is thus assigned to all voxels having a HU ranging from its specified HU up to the next row HU. For example, with the conversion file of Figure 2, HU between -1050 and -951 (included) will be assigned to the ID 39, which corresponds to the Schneider_Air material according to list.dat.
The # character specifies the beginning of a comment. Everything written after the # character will not be considered by MCsquare.
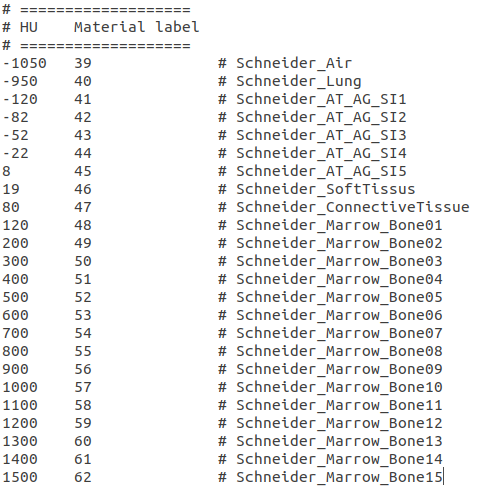
Figure 2: Example of MCsquarre calibration file for the conversion of HU to material ID
(Scanners/default/HU_Material_Conversion.txt)
4. CT calibration process
Several calibration methods exist. However, the most commonly used one is the stoichiometric calibration originally proposed by Schneider et al. in 1996 [1], then revisited for Monte Carlo simulation in 2000 [2].The calibration proposed in reference [2] can be divided in two steps.
The first one consists of the CT calibration itself. A phantom with plastic inserts mimicking various human tissues is imaged by the CT scanner. The average HU number is generally computed from several voxels of the CT image for each material insert. Having one HU value per scanned material, a fit can be performed in order to link HU to material properties. This already provides a first conversion model
As these inserts are made of plastic, which is quite far away from human tissues, a second step is often performed. It consists in using the previously found parameters in order to compute theoretical HU for a list of virtual human tissues with given recommended densities and compositions. The calibration curve is then built upon the HU and properties of these tissues. To do so, Schneider considers in his method that material properties of each human tissue can be calculated by interpolation of two main tissues only. For instance, all bone tissues can be interpolated from marrow and cortical bone (i.e., the lightest and the densest bone parts).
Here are the various steps of the CT calibration process necessary to generate a CT calibration for MCsquare. It follows the methodology presented in [2]:
- Scan the phantom with its plastic material inserts.
- Extract mean HU for each tissue insert.
- Optimize parameters k1, k2 of Eq. (10) in [2] so that theoretical HU match measured HU as well as possible.
- Compute theoretical HU for a list of human tissues having known properties. See for example references [3] and [4].
- Identify the main tissues and, using these HU, recompute tissues properties (density and elemental weights) using the interpolation scheme presented in Section 2.3 of reference [2].
- The HU-to-density calibration curve can be obtained by joining HU/density pairs of all main tissues.
- The HU-to-material calibration curve is then calculated. In his paper [2], Schneider proposes to use 24 materials, defined by their elemental composition. These materials are available in the MCsquare database and correspond to material names starting with "Schneider". The range of HU corresponding to each of these material classes has to be optimized to minimize the error that would be made on the estimated composition for all tissues. For this, properties computed at step 5 should be used. The exact composition of Schneider materials can be found in reference [2].
5. References
[1] Schneider U, Pedroni E, Lomax A, The calibration of CT Hounsfield units for radiotherapy treatmentplanning,Phys. Med. Biol., 1996; 41:111-124.[2] Schneider W, Bortfeld T, Schlegel W, Correlation between CT numbers and tissue parameters neededfor Monte Carlo simulations of clinical dose distributions,Phys. Med. Biol., 2000; 45:459-478.
[3] Woodard HQ, White DR, The composition of body tissuesThe British Journal of Radiology1986;59:1209-1219.
[4] White DR, Woodard HQ, Hammond SM, Average soft-tissue and bone models for use in radiationdosimetry,The British Journal of Radiology1987; 60:907-913.